Imaging-based spatial transcriptomics · 10x Genomics Xenium · FFPE lung adenocarcinoma

Mapping the Immune Landscape of Lung Cancer with Xenium Spatial Transcriptomics

Where are immune cells located within a lung tumour, and which findings hold up under critical evaluation?

An end-to-end, single-cell analysis of the tumour immune microenvironment in a public Xenium tissue section, with the key findings re-tested against technical artefacts. It is built three ways (Python notebooks, an independent R / Bioconductor replication and a reproducible Snakemake workflow); the Python notebooks and the workflow share one tested Python package, ist_analysis.

154,394
cells after QC
377
genes in the panel
33
annotated cell types
6
TLS-like aggregates
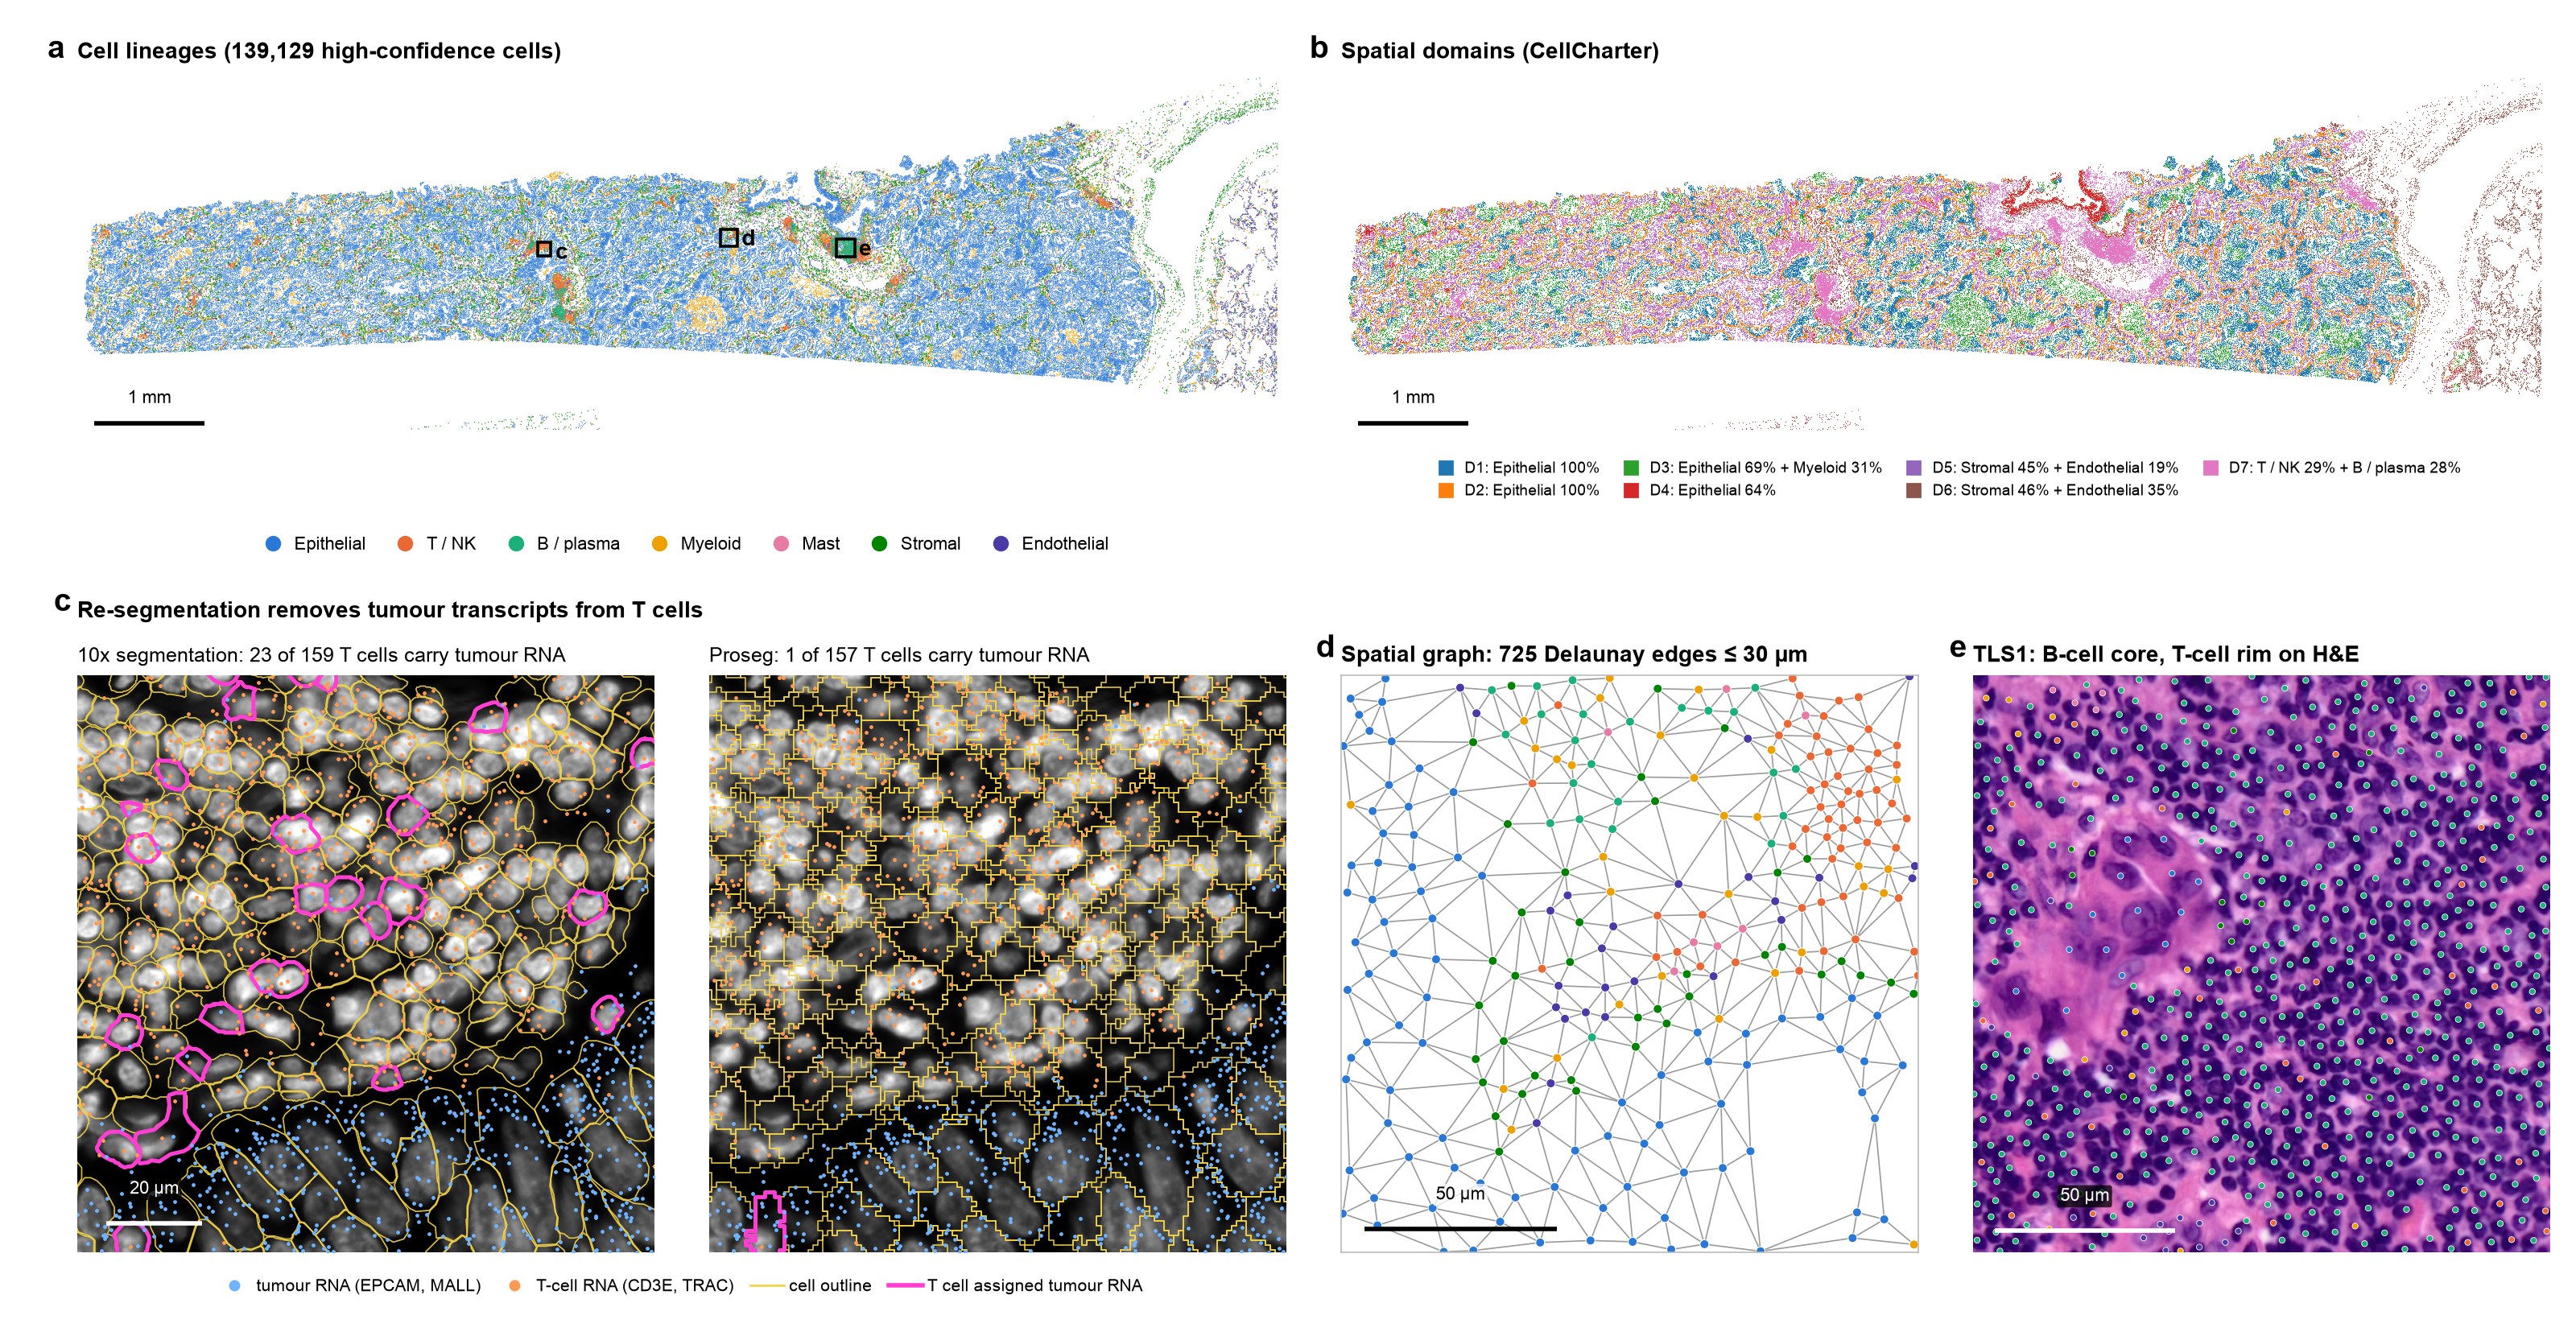
Overview figure: cell lineages, spatial domains, segmentation comparison, neighbourhood graph and a tertiary lymphoid structure on H&E
Figure 1. Spatial organisation and analysis workflow of a lung adenocarcinoma section
a, Spatial distribution of 139,129 high-confidence cells, coloured by lineage. Boxes indicate the regions shown in panels c–e. Scale bar, 1 mm.
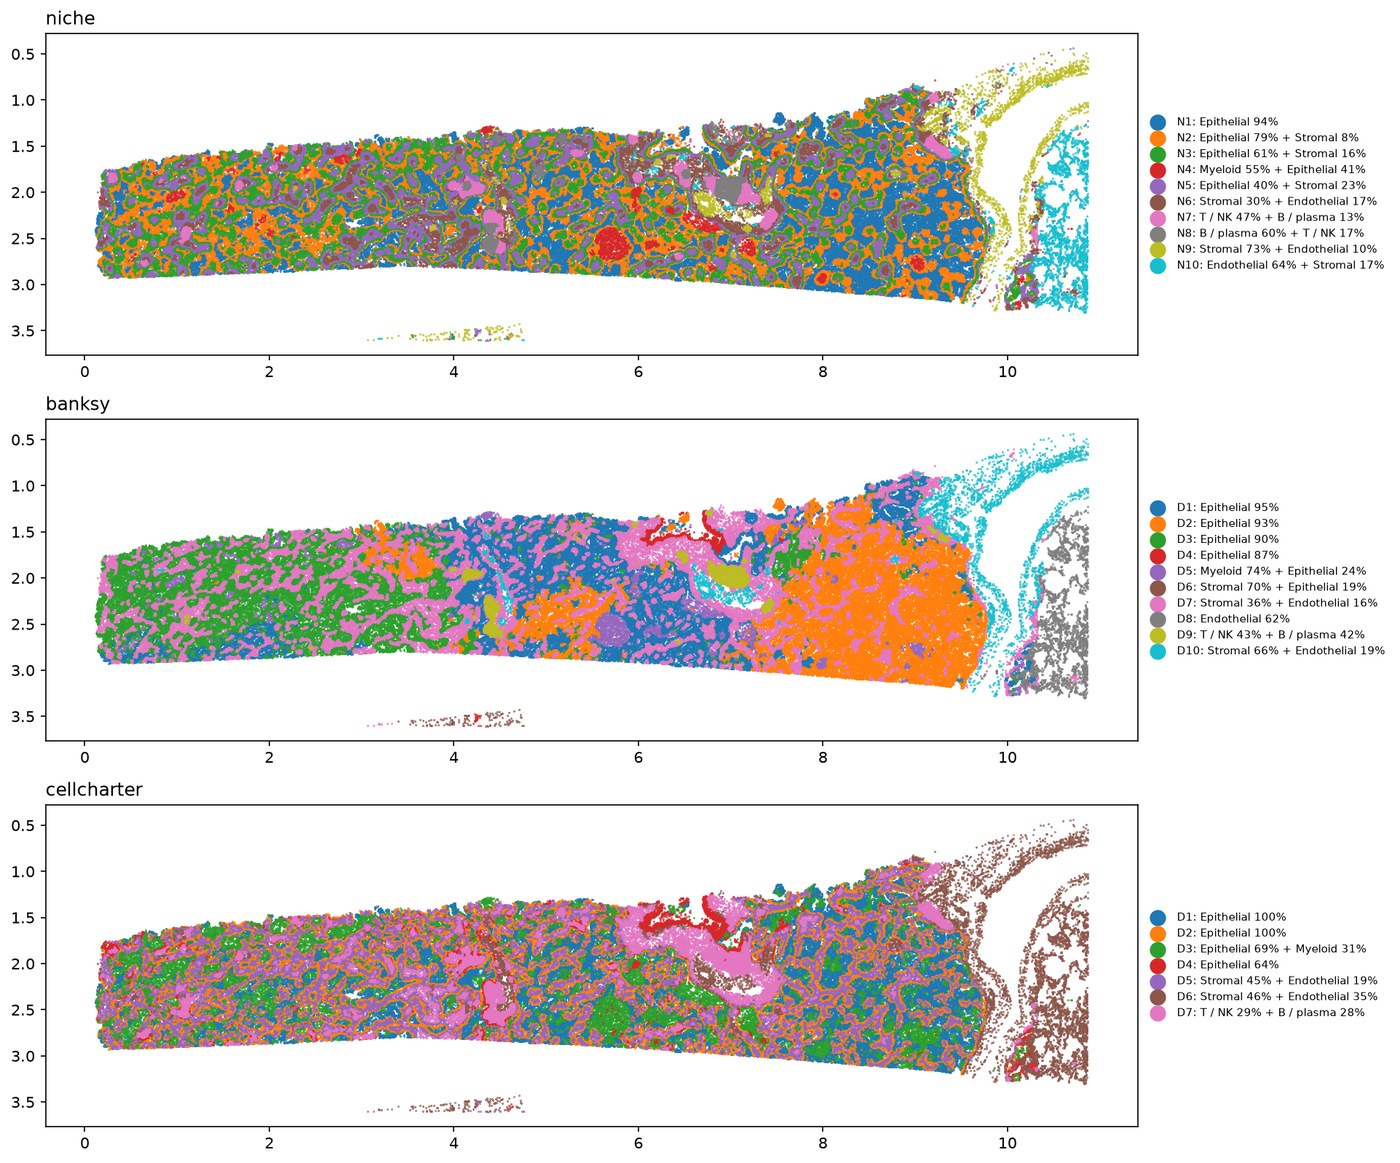
b, Spatial domains identified using CellCharter. Scale bar, 1 mm.
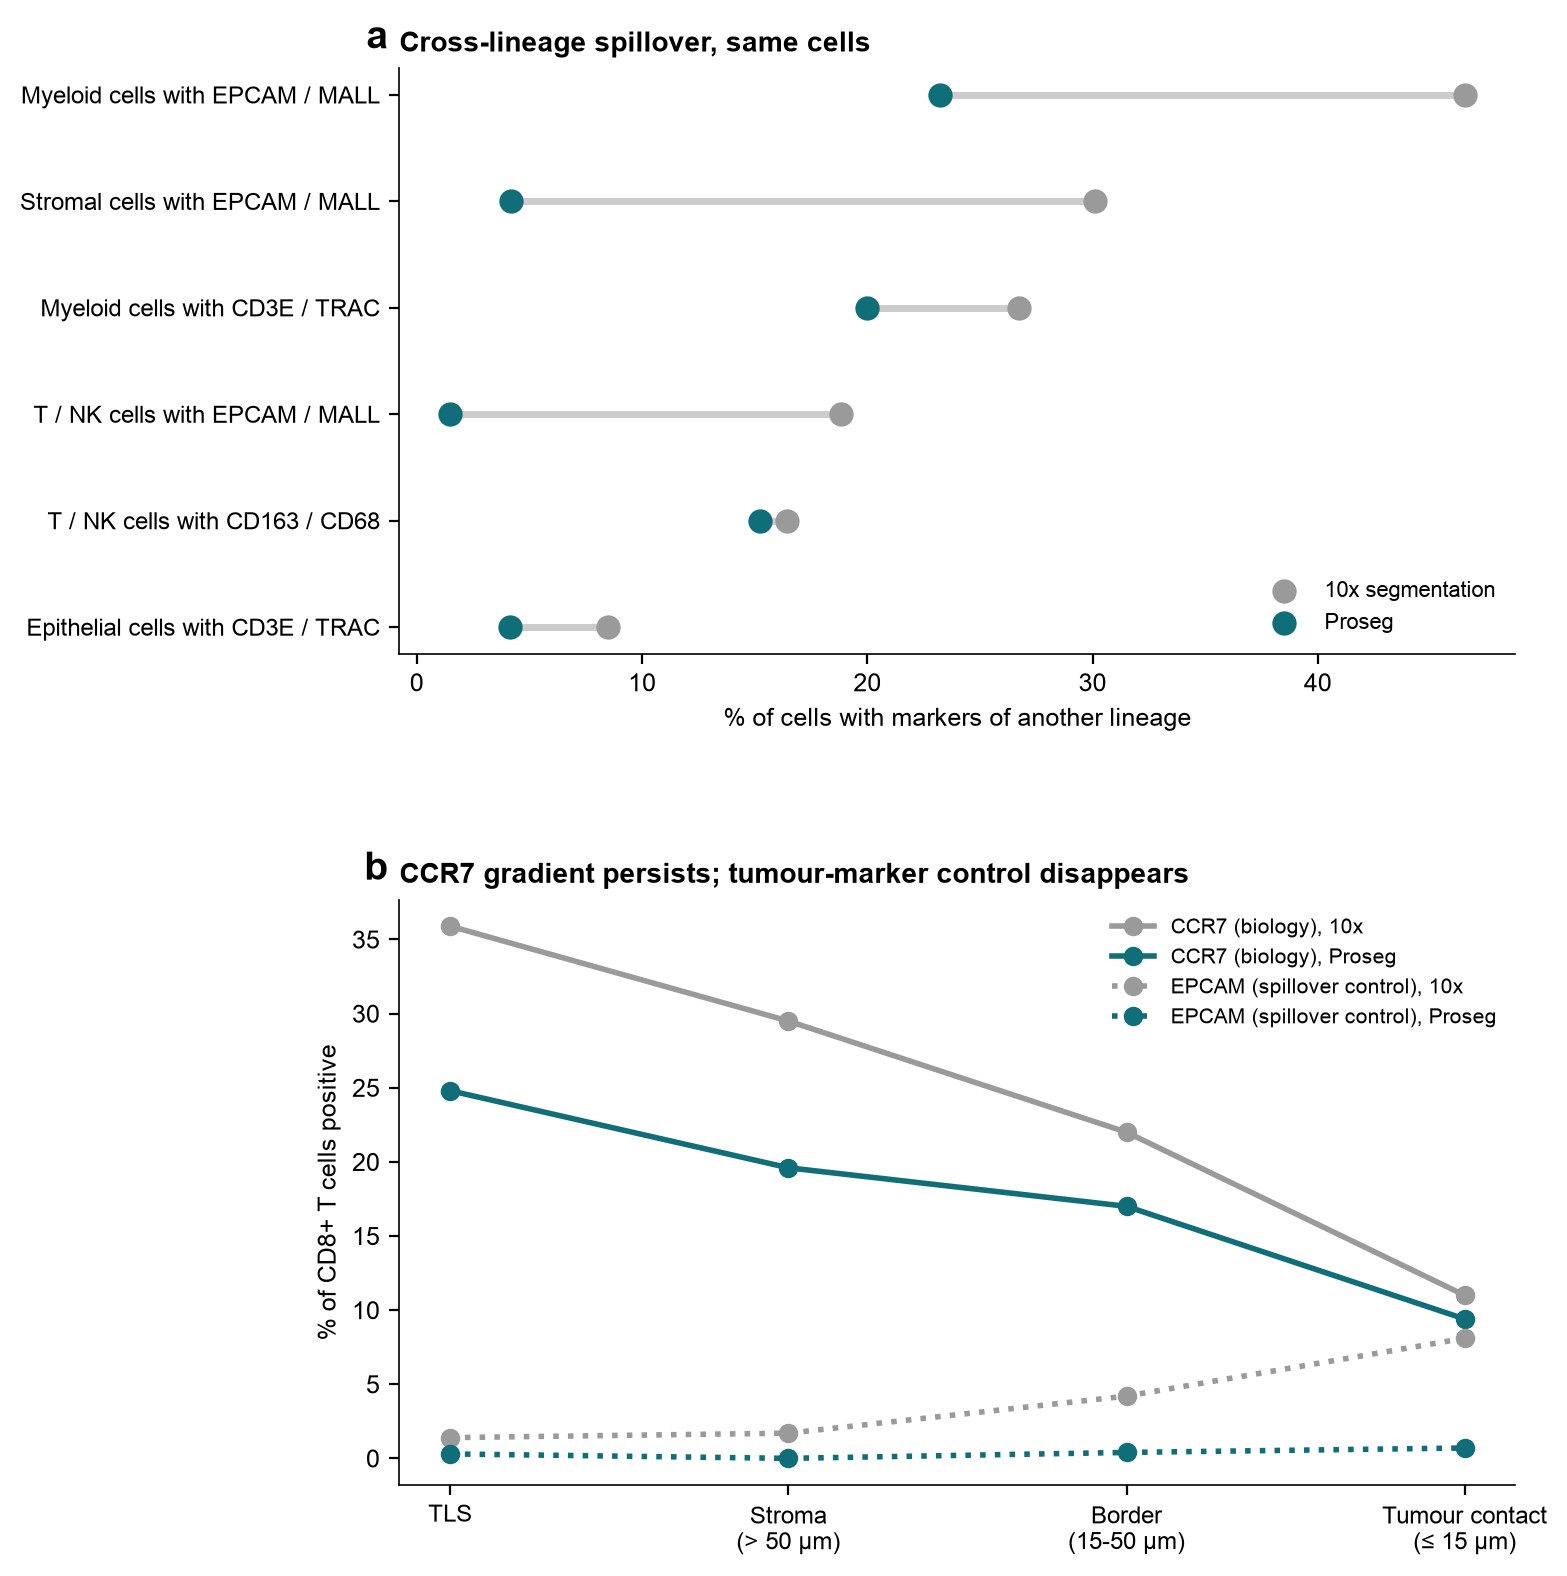
c, Vendor (10x, left) and Proseg (right) cell segmentations overlaid on DAPI at a tumour–T-cell interface (120 × 120 µm), selected for the densest overlap of tumour and T-cell transcripts. Magenta outlines identify T cells assigned epithelial transcripts (EPCAM or MALL): 23 of 159 cells with 10x versus 1 of 157 with Proseg. Across the section, the corresponding proportions were 18.8% and 1.5% of T / NK cells. Proseg cells inherit lineage annotations from their matched 10x cells. Scale bar, 20 µm.
d, Delaunay spatial neighbourhood graph, restricted to edges ≤30 µm, at a tumour–stroma–immune interface (150 × 150 µm). Scale bar, 50 µm.
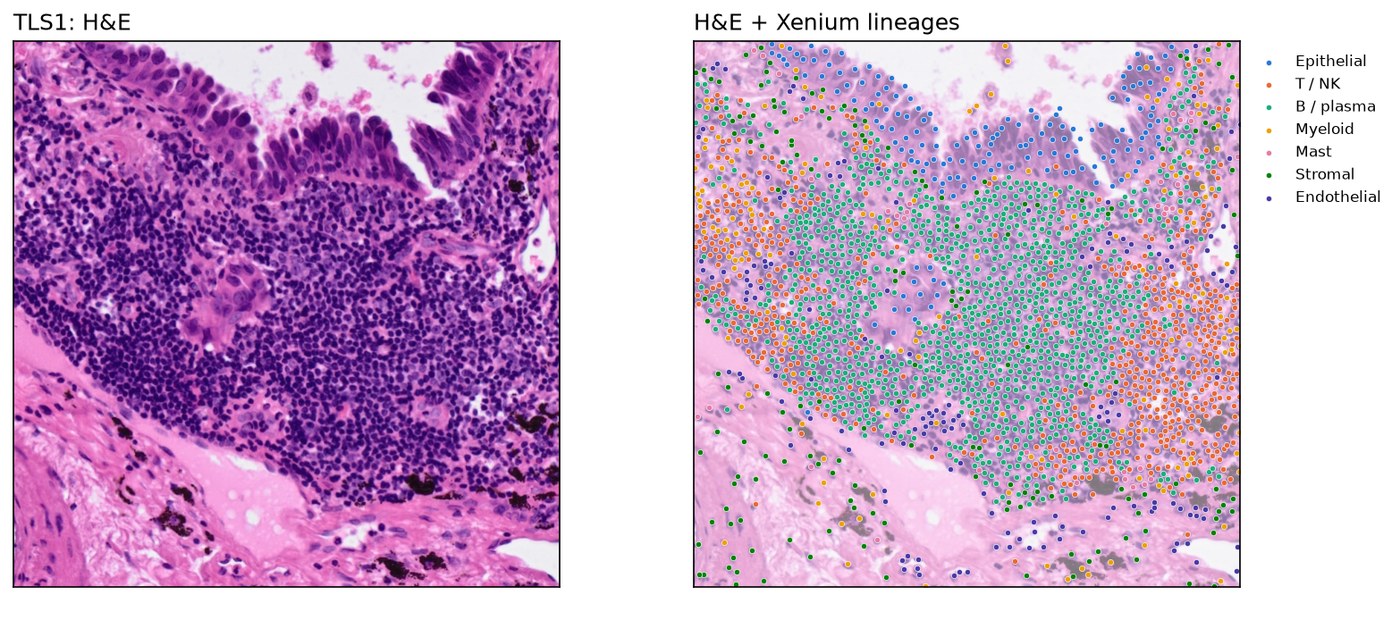
e, TLS-like aggregate TLS1 on matched H&E (160 × 160 µm), with Xenium cell centroids coloured by lineage. Scale bar, 50 µm.
Lineage colours are consistent across panels a and c–e.

Key findings

1

Predominantly CD8-excluded tumour regions

Only 12% of GZMK+ CD8 T cells lay within 15 µm of a tumour cell, compared with 34% of non-tumour cells overall, whereas alveolar and FCGR1A+ macrophages, cDC2 cells and fibroblasts lay closer to tumour cells than this baseline.

Of the 119 tumour-containing 400 µm tiles scored, 65% were classified as immune-excluded, 26% as immune-desert and 9% as inflamed under the default thresholds; excluded remained the most frequent label across all nine threshold settings tested (50–75% of tiles), and the R replication reproduced the same overall split.

These labels are operational, based on centroid distances and density thresholds. Together, these results suggest a predominantly CD8-excluded spatial pattern in this tissue section, with relatively few inflamed regions.
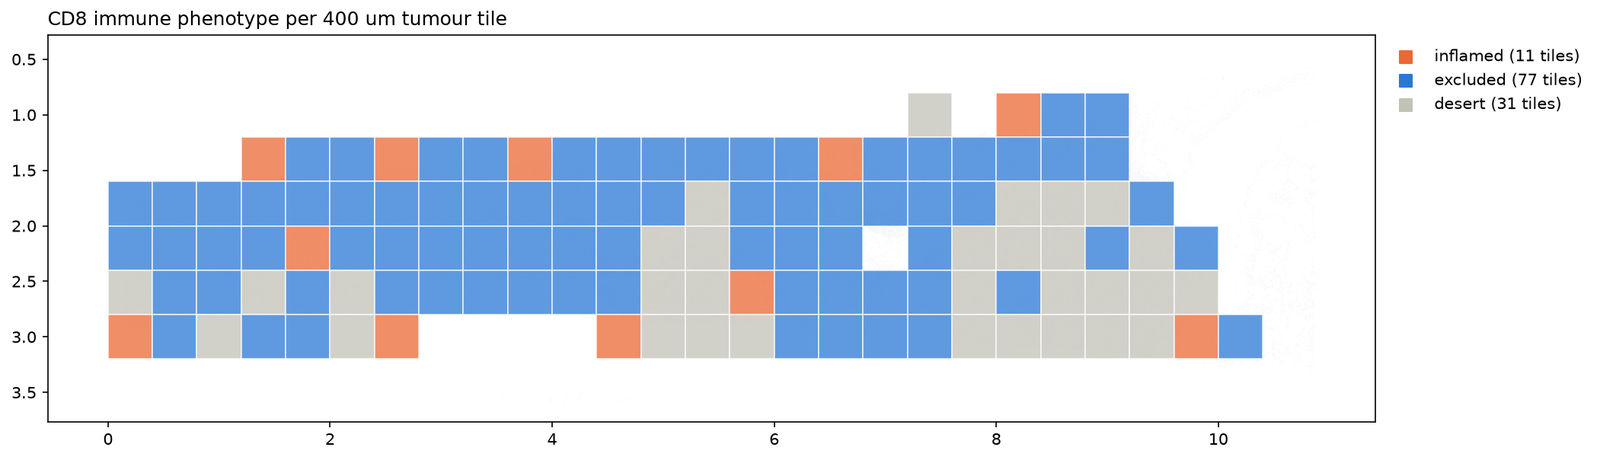
Map of immune phenotypes per 400 micrometre tumour tile
2

Six TLS-like aggregates show organised lymphoid architecture

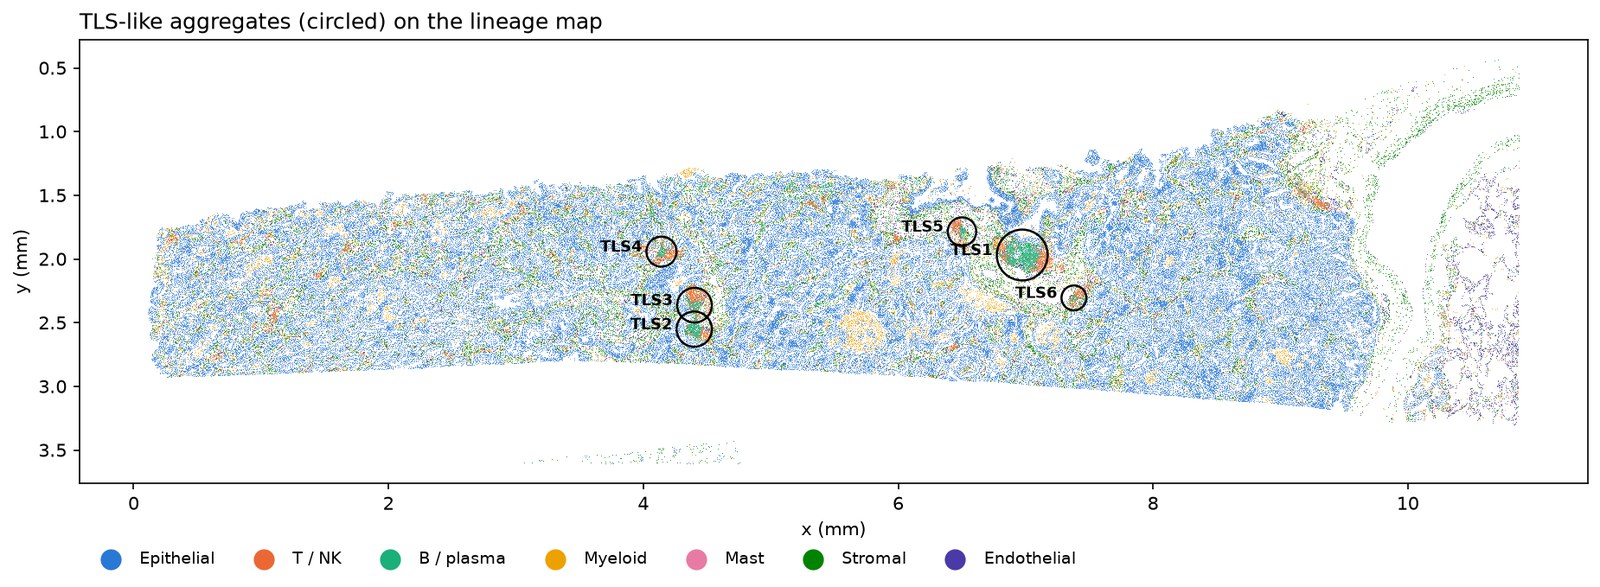
Six tertiary lymphoid structure (TLS)-like aggregates contained 71% of B cells. Each combined B cells (22–65% of cells) with T / NK cells (17–50%), mregDCs and CCL19-expressing cells, with few tumour cells; the largest (TLS1) corresponds to a dense lymphoid aggregate on the matched H&E.

CCR7 was detected in 36% of GZMK+ CD8 T cells within the aggregates and in 11% of those within 15 µm of tumour cells. Graph contacts between CCL19-positive and CCR7-positive cells were 2.35-fold the expectation under a null that shuffles expression within cell types, and the CCR7 difference persisted after cell re-segmentation.

Together, these results are consistent with organised lymphoid niches in this section, with distinct CD8+ T-cell states near the aggregates and near the tumour. The aggregates are termed TLS-like because TLS-maturity markers (CXCL13, CR2, CCL21) are absent from the panel, and contact enrichment indicates spatial co-occurrence rather than demonstrated signalling.

Cell lineage map with the TLS-like aggregates marked The largest TLS-like aggregate on the H&E image
3

FCGR1A+ macrophage expression varies by spatial domain

Paired pseudobulk DESeq2 analysis of BANKSY- and CellCharter-defined domains found higher TREM2, CTSK and LPL expression in stromal FCGR1A+ macrophages, and higher MARCO, MCEMP1 and CXCL2 expression in tumour-adjacent macrophages.

Of 60 initially significant genes, 42 were excluded because their signals were attributable to neighbouring-cell transcripts. The remaining differences persisted with re-segmented counts.

These findings indicate location-associated expression differences within this section. However, the 1 mm tissue blocks are not independent biological replicates, making the p-values optimistic; functional consequences were not tested.

Spatial domains from BANKSY and CellCharter
4

Main findings persist after cell re-segmentation

Proseg re-segmentation reduced the proportion of T / NK cells containing neighbouring epithelial transcripts from 19% to 1.5%. CD8 exclusion persisted (12% versus 34% within 15 µm of tumour cells), all six TLS-like aggregates were re-identified within 3–9 µm of their original locations, and CCR7 expression remained higher in GZMK+ CD8 T cells within the aggregates than within 15 µm of tumour cells (25% versus 9%).

Lineage annotations agreed with the Lung Cancer Atlas (LuCA; 892,000 cells) for 92% of high-confidence cells, with lower agreement for T / NK cells (63%). Conventional CD4 T cells remained unresolved under both segmentations.

These checks support robustness to segmentation spillover within this tissue section; they do not establish consistency across patients.

Left: percentage of cells carrying markers of another lineage under the 10x and Proseg segmentations. Right: CCR7 and the EPCAM spillover control in CD8+ T cells by tissue compartment under both segmentations
5

H&E features predict lineage better than immune states

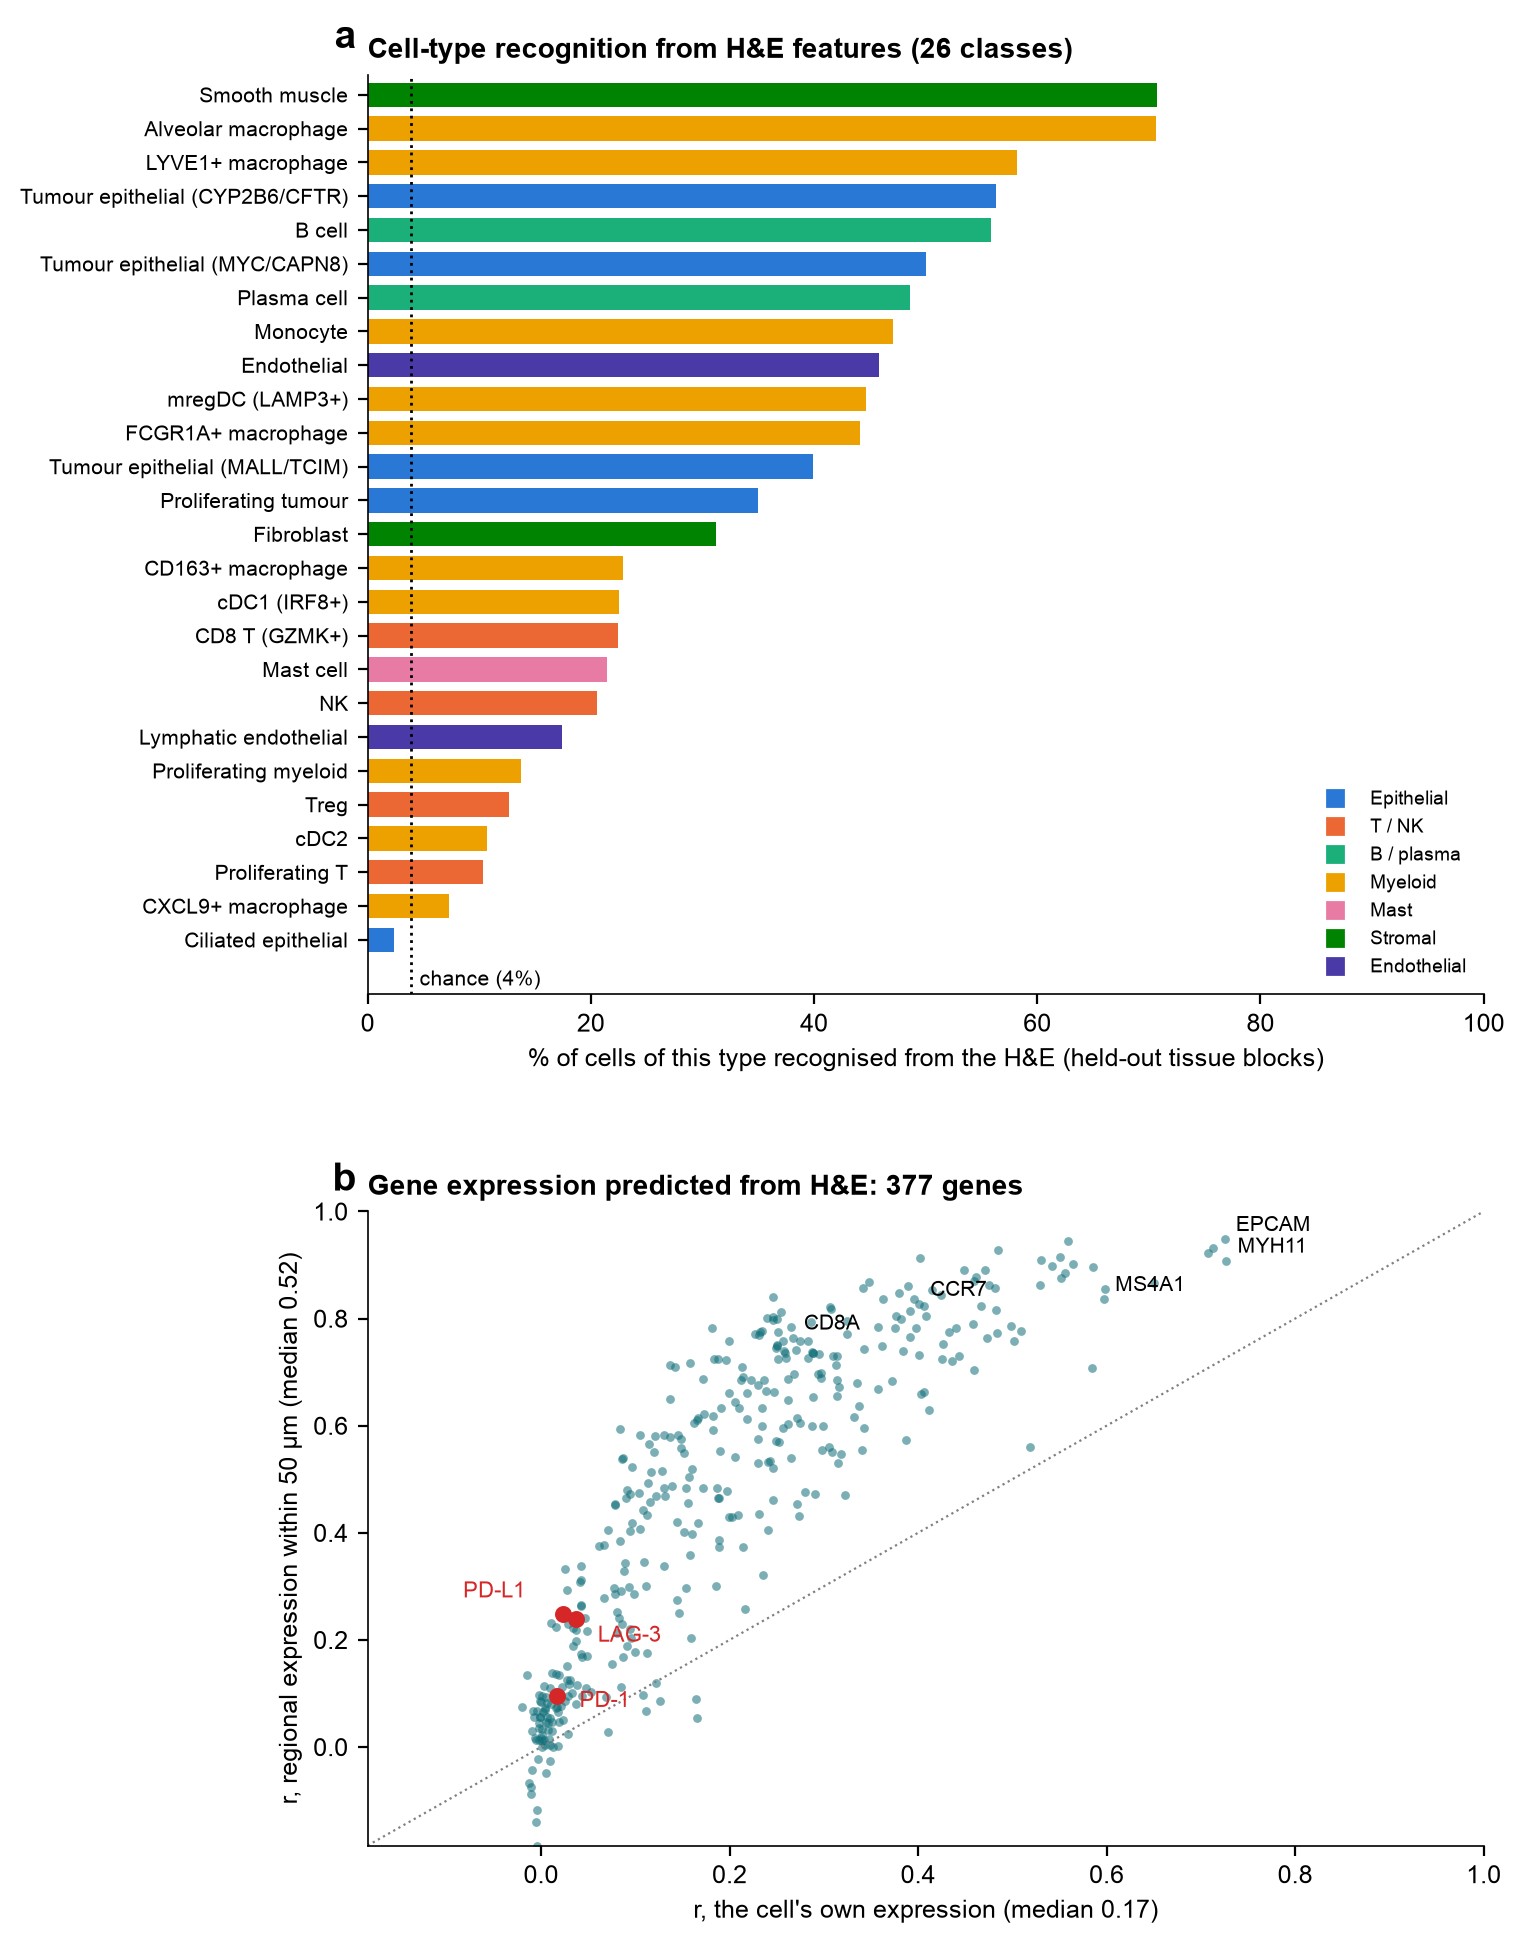
Features from Phikon-v2, a pathology foundation model, extracted at each cell’s position on the matched H&E predicted cell lineage with 57% balanced accuracy in spatially held-out tissue blocks, compared with 14% chance accuracy and 45% for a Xenium-neighbour-based control. Cell-type prediction reached 34% balanced accuracy, compared with 4% chance accuracy.

Recognition was highest for epithelial cells (90%), smooth muscle cells and alveolar macrophages (71% each), but low for regulatory T cells (13%) and CXCL9+ macrophages (7%). Regional gene expression was better predicted than single-cell expression (median r = 0.52 versus 0.17); checkpoint transcripts PD-1, PD-L1 and LAG-3 showed little predictive signal (r ≤ 0.04).

These findings describe the performance of one model’s H&E features in this tissue section, not the general limits of histology.

Top: percentage of cells of each of 26 cell types recognised from H&E features, coloured by lineage, with the chance level. Bottom: for 377 genes, prediction accuracy from H&E for each cell's own expression versus regional expression, with PD-1, PD-L1 and LAG-3 highlighted

Explore

Notebooks

Explore the analysis notebooks with saved outputs; no installation required to view them.

01 · Core analysis (Python) Steps 1–10: data download, quality control, clustering, cell annotation, spatial statistics with squidpy, H&E integration, and tumour immune microenvironment analysis.
01 · Core analysis (R) R / Bioconductor replication using Seurat, SpatialExperiment, imcRtools, Banksy, CellChat, and spatstat, with results cross-checked against the Python analysis.
02 · Cell re-segmentation Proseg re-segmentation, comparison of transcript spillover before and after re-segmentation, and assessment of whether the main findings persist.
03 · Reference mapping Cell-type annotation assessment against the Lung Cancer Atlas, with held-out-donor evaluation to contextualise mapping accuracy.
04 · Spatial domains Spatial domain identification with BANKSY and CellCharter, followed by paired pseudobulk DESeq2 analysis of location-associated macrophage expression differences.
05 · H&E foundation model Evaluation of Phikon-v2 H&E features for predicting cell identities, gene expression, and spatial domains from tissue morphology.

One implementation, two execution paths

The analysis logic is centralised in ist_analysis, a package for imaging-based spatial transcriptomics. Xenium-specific input handling is isolated in ist_analysis/io/xenium.py, while downstream functions operate on a standard AnnData object.

The Python notebooks and the Snakemake workflow call the same analytical functions, keeping the implementation consistent across execution paths. The R notebook is an independent re-implementation in R / Bioconductor, used to cross-check the results. Unit tests using synthetic data run on every push.

This separation of input handling from analysis provides a foundation for extending the package to other platforms, including MERSCOPE and CosMx.

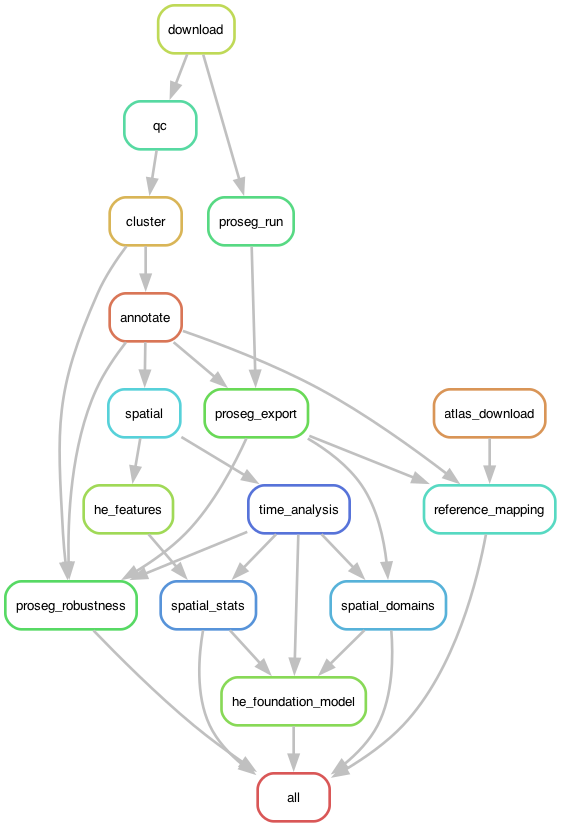
The pipeline at a glance: the core workflow (Steps 1-10) and the analyses that re-test and extend it (notebooks 02-05), with the key number each step produces. Open full screen.
Snakemake rule graph of the pipeline
Snakemake rule graph: the core chain from download to spatial analysis, with re-segmentation, atlas mapping and spatial domains branching off.

How to cite

Project design, analysis, software development, and interpretation by MD Shakhaowat Hossain.

If you use this analysis or its code, please cite:

Hossain, M. S. (2026). Xenium human lung cancer (FFPE): Spatial analysis of the tumour immune microenvironment (Version 1.1.0) [Computer software]. GitHub. https://github.com/hossainms/xenium-human-lung-cancer-ffpe

Citation metadata is provided in CITATION.cff and is accessible through GitHub’s “Cite this repository” button. Please also cite the datasets and methods listed below, as applicable to your use.

Contact

Questions, feedback, and discussions about applications of this work are welcome. Contact me at shakhaowatdu@gmail.com.

Data and attribution

Xenium Human Lung Cancer FFPE (Xenium v1, Human Multi-Tissue and Cancer panel), 10x Genomics public datasets, CC BY 4.0. Lung Cancer Atlas (LuCA) core atlas, Salcher et al., Cancer Cell 2022, via CELLxGENE, CC BY 4.0. Methods: Proseg, BANKSY, CellCharter, CellTypist, squidpy, scanpy, spatialdata, PyDESeq2; in R, Seurat, SpatialExperiment, imcRtools, Banksy, SingleR, CellChat and spatstat.